Signal Strength
The Signal Strength page shows information about signal strength events. The page includes the following information:
Timeline graph
The graph displays signal strength values on the timeline for the selected log:
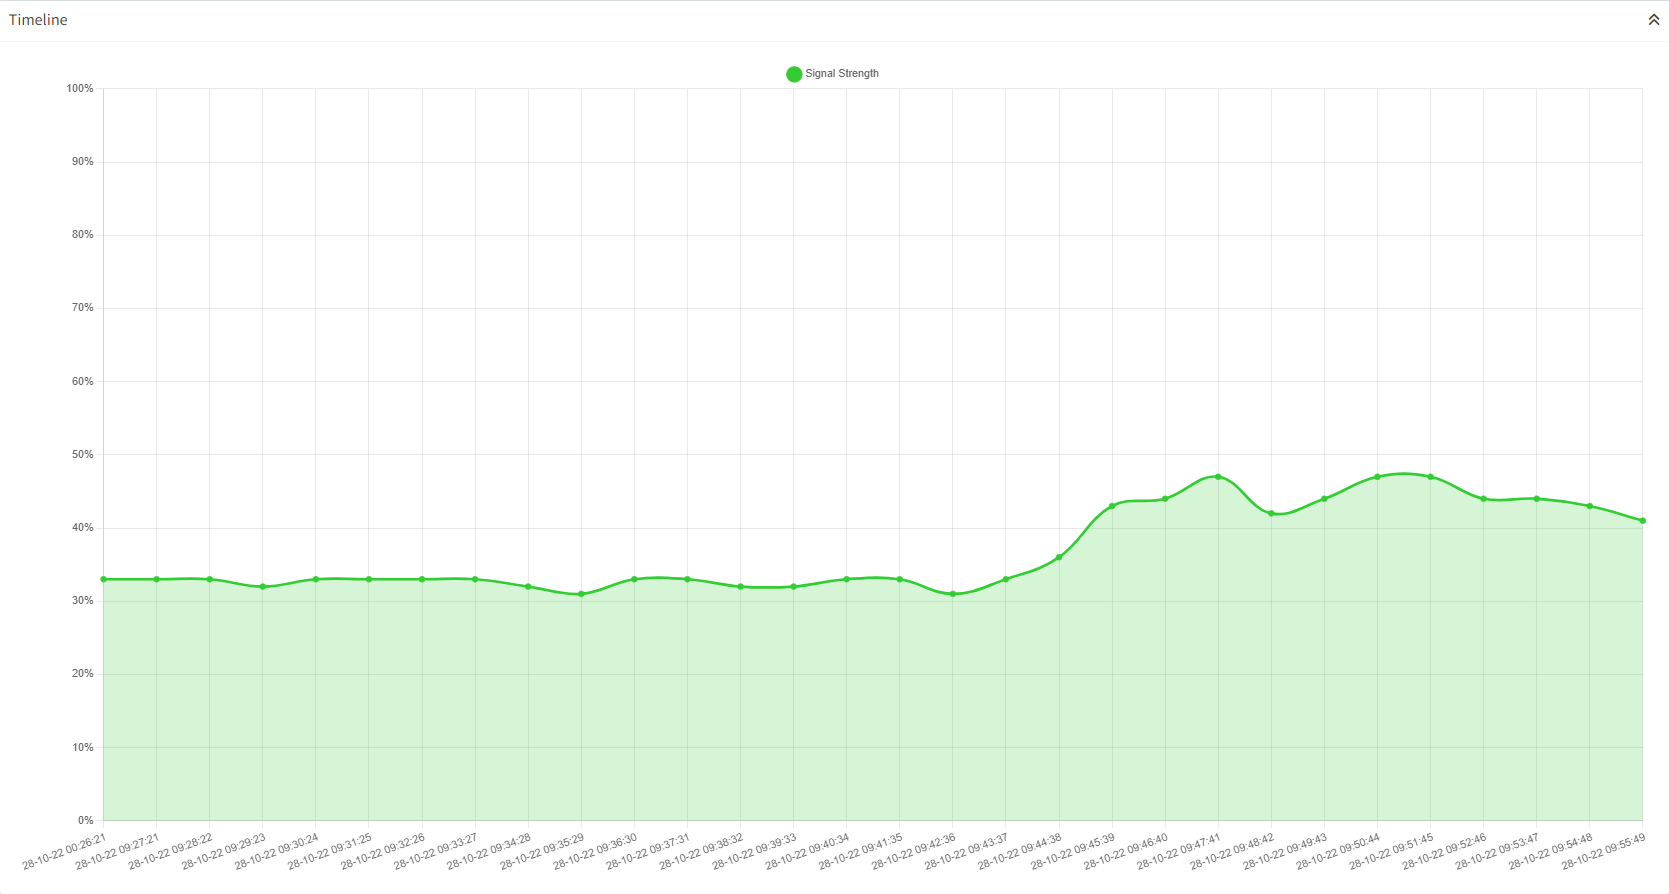
Timeline Graph
Summary Table
The table displays summarized info based on the previous graph:
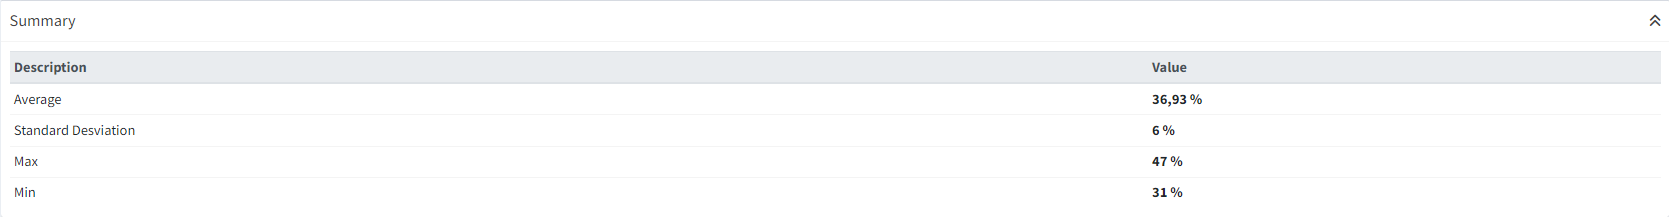
Summary Table
Summary per AP Table
This table displays the signal strength average value and number of samples used to calculate it for each AP.

Summary per AP Table
In the Signal Strength Filter section, select the filters by:
- entering local dates and times
Next click the Find button or press Enter.
Filters can be removed by clicking the Clear and Find buttons in that order.
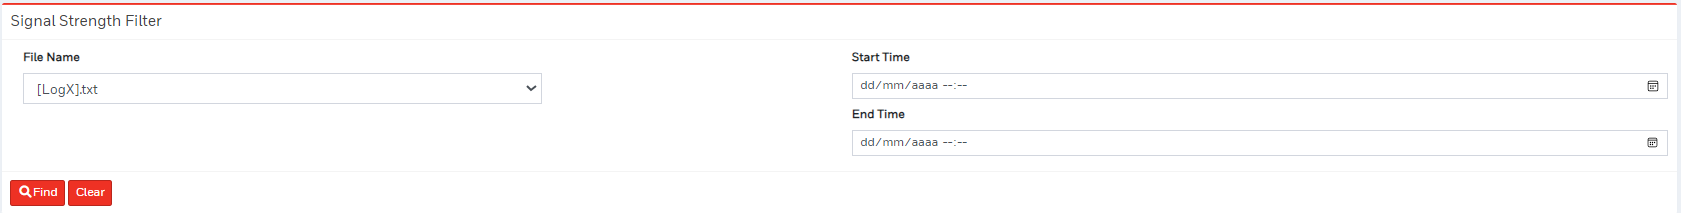
Signal Strength Filter Panel