Host Communications Filter
The Host Communications page displays communication with the host server (LUTs/ODRs). The page includes the following information.
Connection Establishment Graphs
These graphs display the host connect timeline on the horizontal axis.
The left vertical axis displays the connection accomplishment time in milliseconds. The connection establishment graph is made up of a green (success) and red (error) indicators.
Additional data is shown depending on the option selected.
Latest Registered AP
The MAC address of the AP is displayed. The right vertical axis shows the registered AP over time shown with blue indicators for the time connected to that AP.
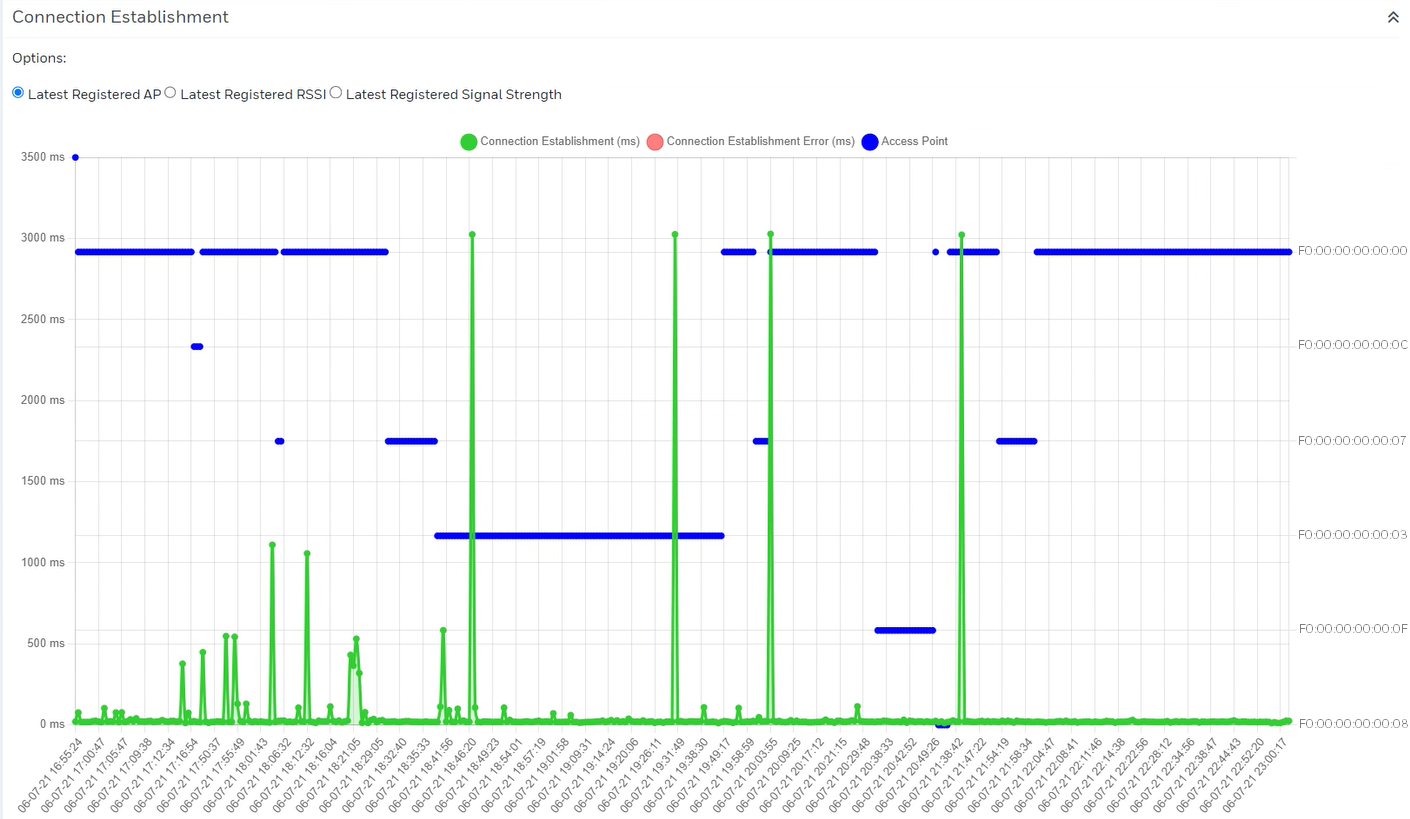
Connection Establishment Graph with Registered AP
Logs from DevKit apps do not contain information about Connection Establishment, so the graph only depicts Data Transmission, which also includes the time to create a connection and to transmit the data.
Latest Registered RSSI
The right vertical axis shows the registered RSSI over time shown with blue indicators.
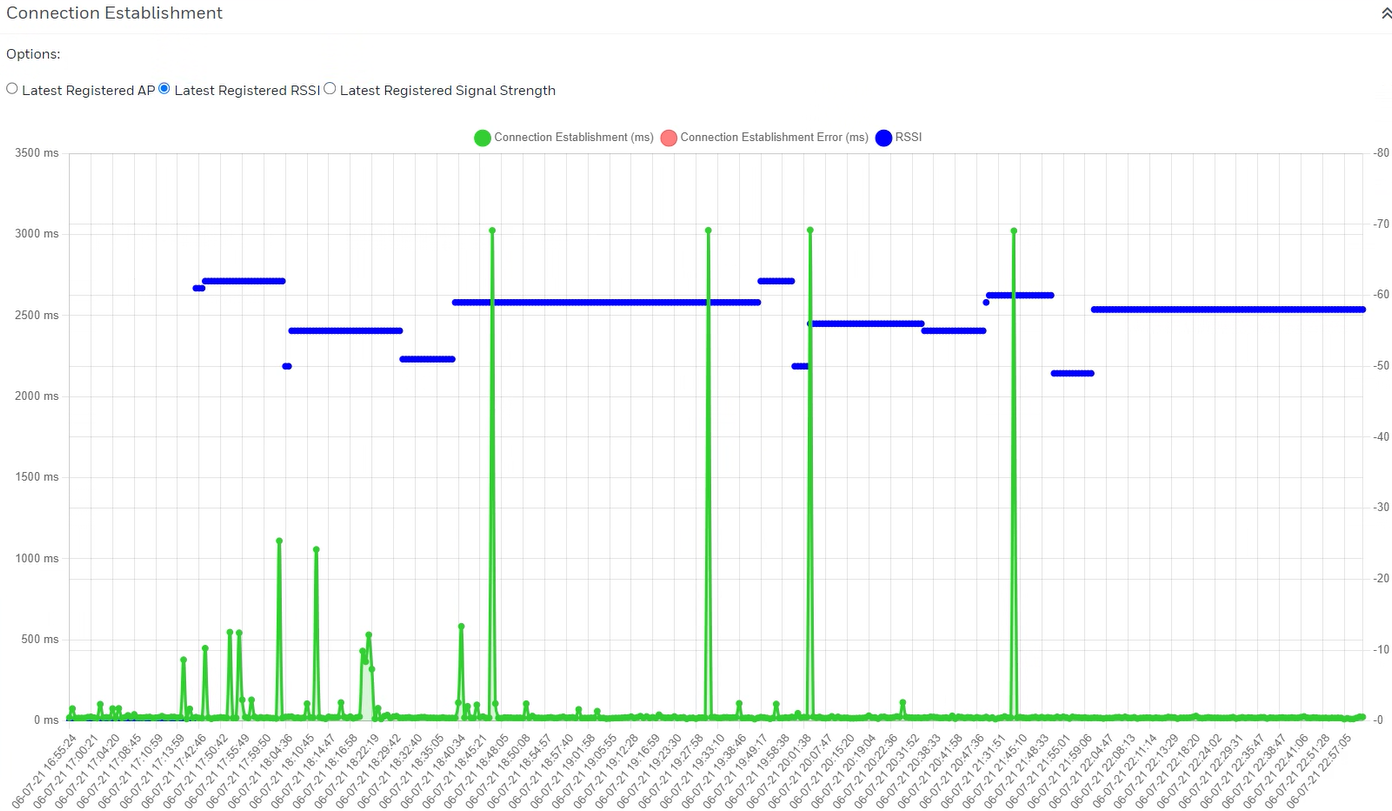
Connection Establishment Graph with RSSI
Logs from DevKit apps do not contain information about Connection Establishment, so the graph only depicts Data Transmission, which also includes the time to create a connection and to transmit the data.
Latest Registered Signal Strength
The right vertical axis shows the registered signal strength as a percentage over time shown with blue indicators.
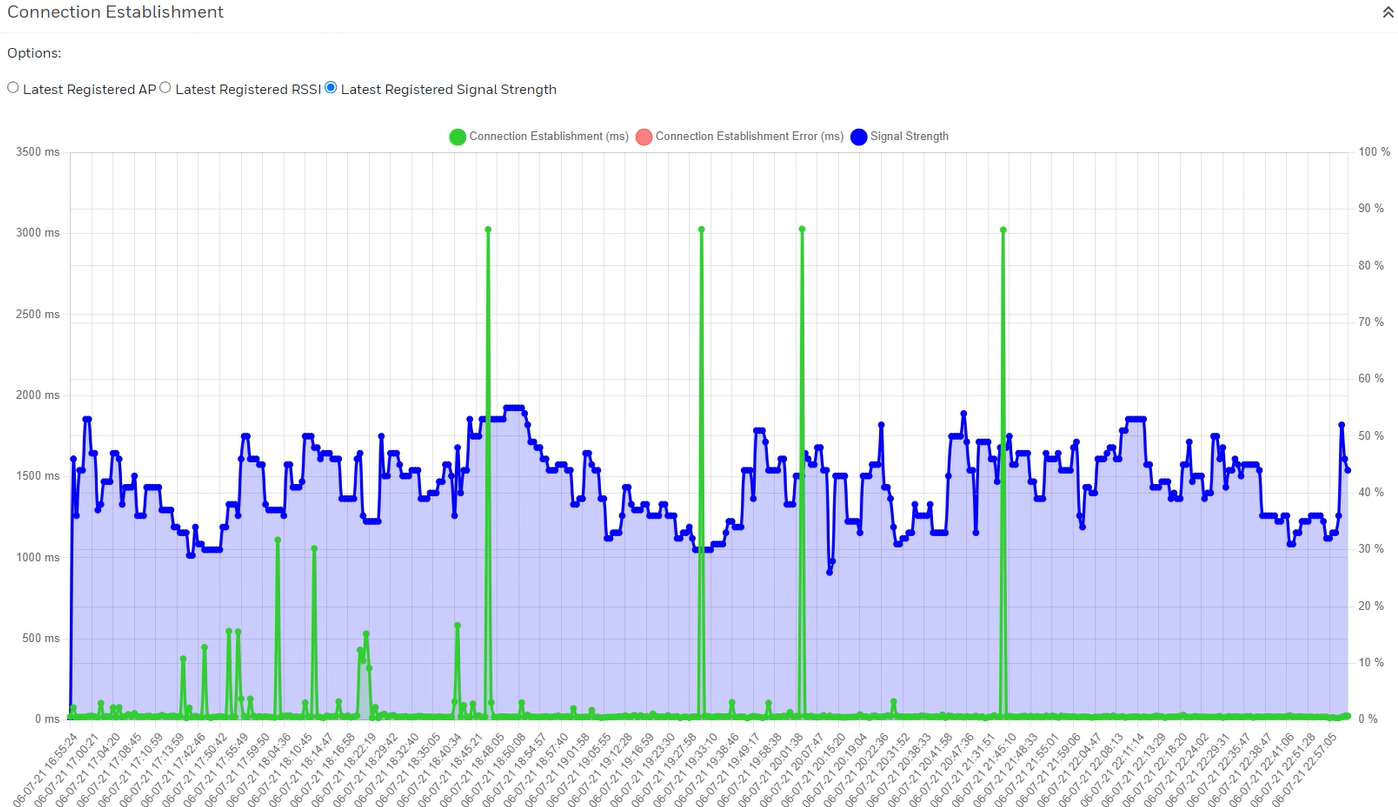
Connection Establishment Graph with Signal Strength
Logs from DevKit apps do not contain information about Connection Establishment, so the graph only depicts Data Transmission, which also includes the time to create a connection and to transmit the data.
Data Transmission Graph
This graph displays the data transmission timeline on the horizontal axis.
The left vertical axis displays the data transmission time in milliseconds. The data transmission graph is made up of an orange (success) and red (error) line.
Additional data is shown depending on the option selected.
Latest Registered AP
The MAC address of the AP is displayed. The right vertical axis shows the registered AP over time shown with blue indicators for the time connected to that AP.
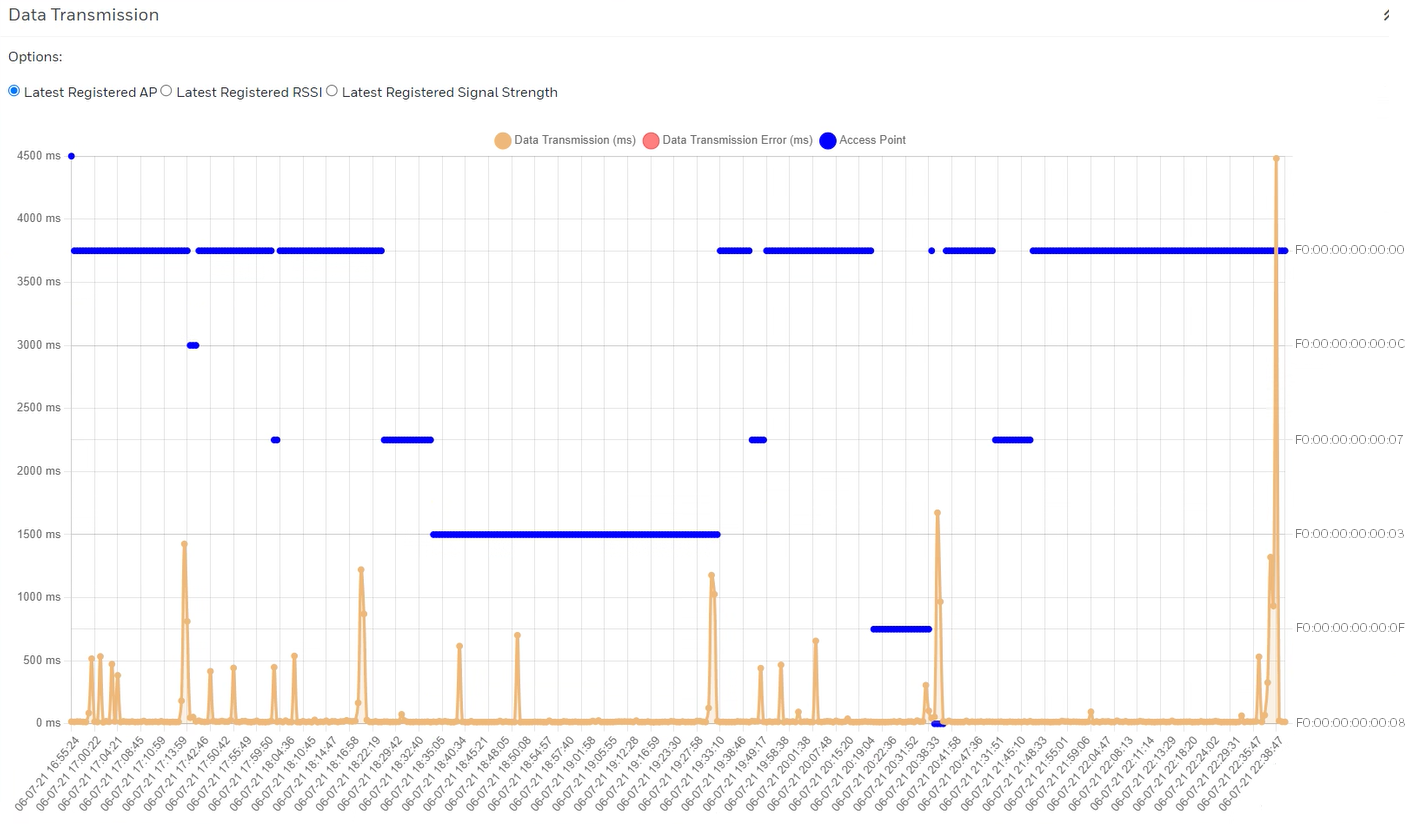
Data Transmission Graph with Registered AP
Latest Registered RSSI
The right vertical axis shows the registered RSSI over time shown with blue indicators.
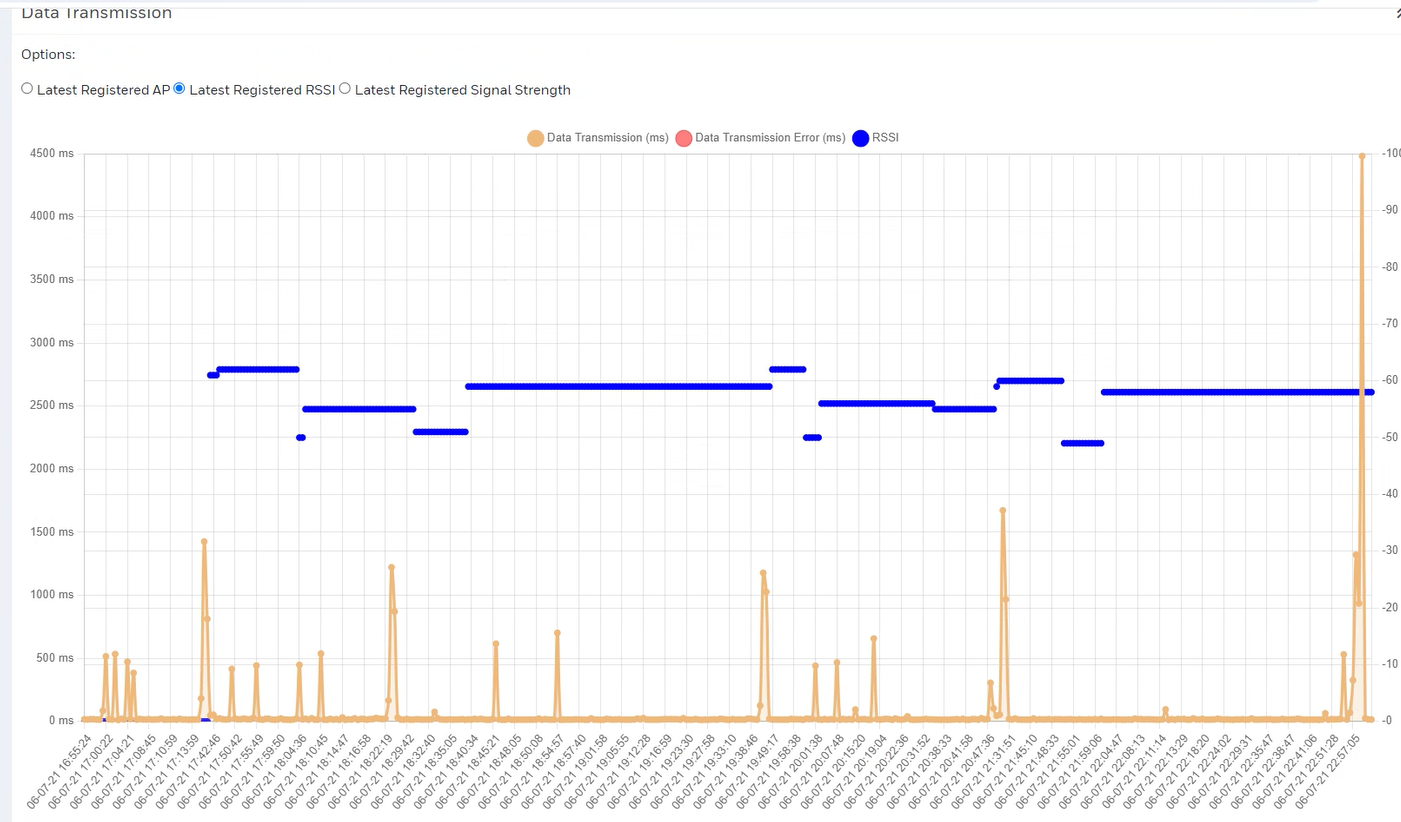
Data Transmission Graph with RSSI
Latest Registered Signal Strength
The right vertical axis shows the registered signal strength as a percentage over time shown with blue indicators.
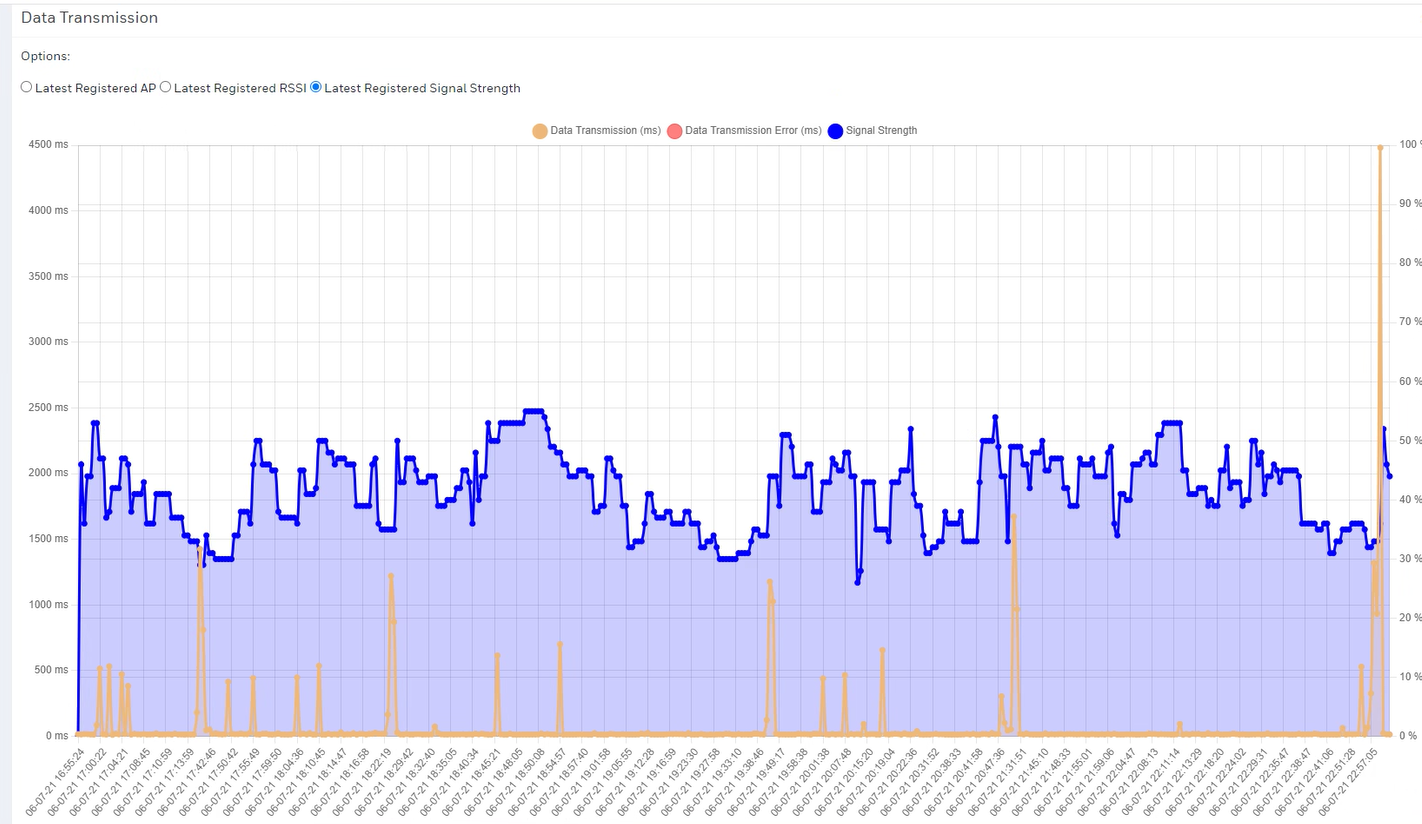
Data Transmission Graph with Signal Strength
Total Host Communications Table
This table displays a summary for the host connection and transmission events.

Summary Table for Host Communication Events
Connection Events List
This list displays all registered host connection events ordered on the timeline with data about: Status, Latest Registered Signal Strength/AP/RSSI, Timeout Established, Connection/Error counts, and the Host and Port to which the device attempts to connect.
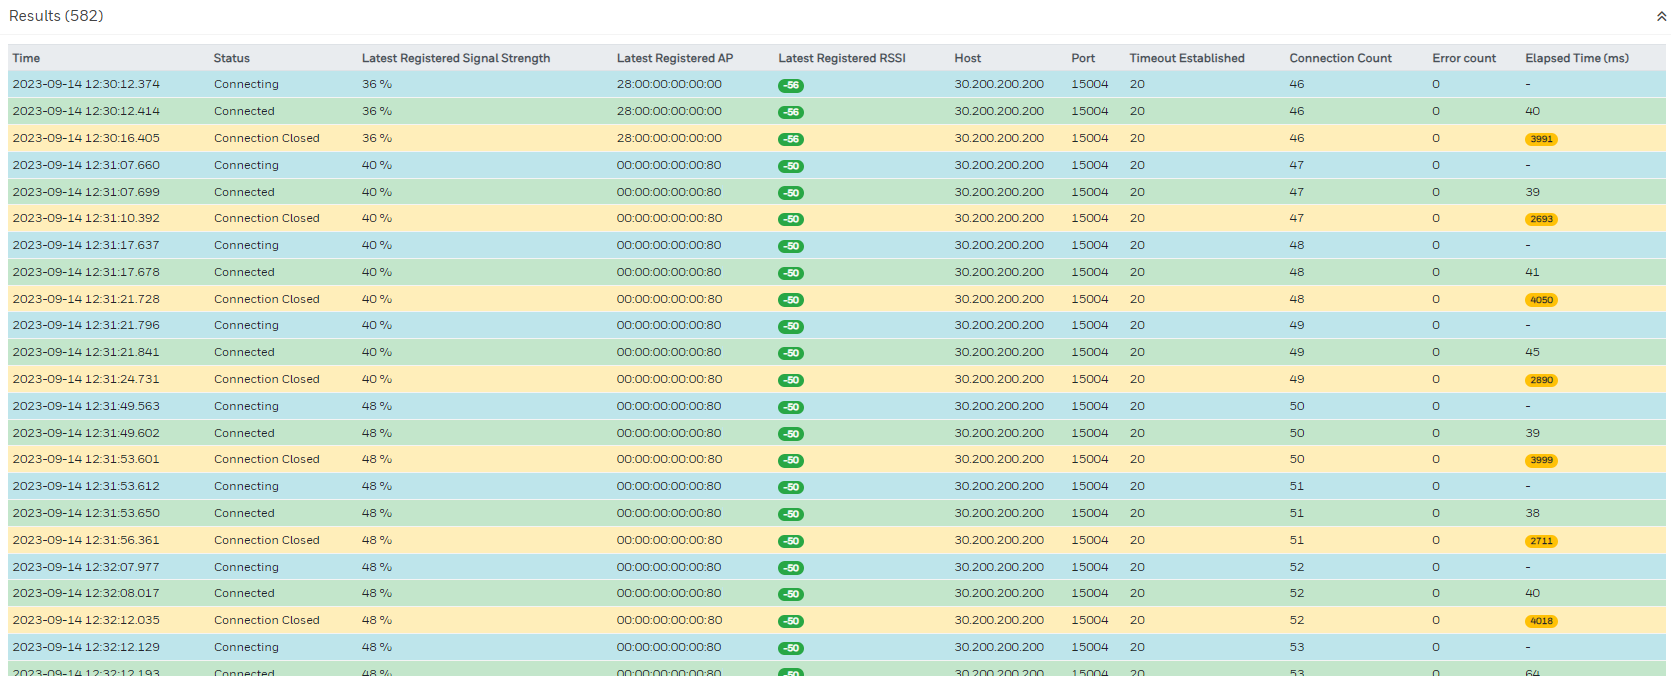
Connection Events List
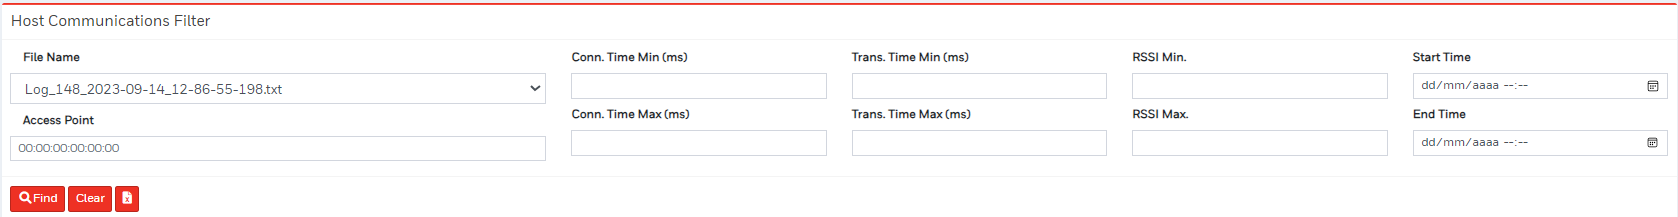
Host Communications Filter Panel
In the Host Communication Filter section, select the filters by:
- entering maximum or minimum values for connection or transmission times
- minimum or maximum RSSI
- entering local dates and times
- entering the MAC address for an Access Point
Next click the Find button or press Enter.
Filters can be removed by clicking the Clear and Find buttons in that order.